Virtual Tour Analytics: Tracking Performance and Engagement
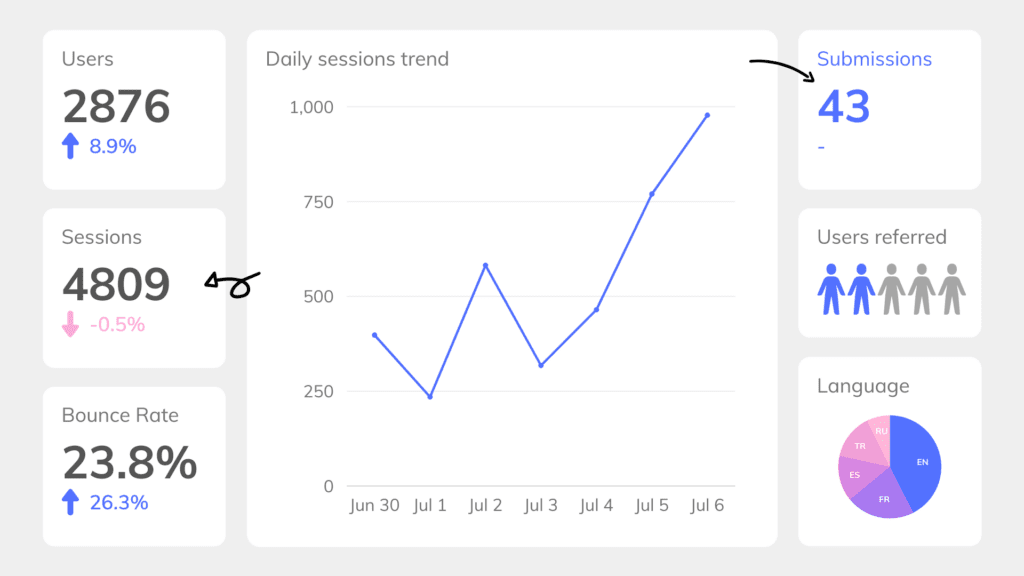
Creating stunning virtual tours is just the first step. To truly maximize their impact, you need to understand how viewers are interacting with them. Matterport’s built-in analytics provide valuable data and insights into viewer behavior, allowing you to track performance, measure engagement, and optimize your virtual tours for better results. This blog post explores the key aspects of virtual tour analytics and how to leverage them for success.
Key Matterport Analytics Metrics
Matterport tracks a variety of metrics that provide valuable insights into how viewers are engaging with your virtual tours:
- Visits: The total number of times your virtual tour has been viewed.
- Unique Visitors: The number of individual visitors who have viewed your tour.
- Average Duration: The average amount of time viewers spend exploring your tour.
- Mattertag Views: The number of times viewers have clicked on Mattertags (annotations) within your tour.
- Links Clicked: The number of times viewers have clicked on links embedded within your tour.
- Dollhouse View Usage: How often viewers utilize the Dollhouse View to navigate the space.
- Floor Plan Usage: How often viewers use the Floor Plan to navigate.
- Device Type: The types of devices (desktop, mobile, tablet) used to view your tour.
- Location: The geographic location of your viewers.
Understanding Viewer Behavior
These metrics provide valuable insights into viewer behavior:
- Popular Areas: Identify which areas of your tour are most popular and which are less explored.
- Engagement with Mattertags: Understand which Mattertags are attracting the most attention and which are being overlooked.
- Navigation Patterns: See how viewers are navigating through the tour and identify any potential bottlenecks or areas of confusion.
- Device Preferences: Understand how viewers are accessing your tour and optimize the experience for different devices.
Using Analytics to Optimize Your Virtual Tours
Matterport analytics empower you to make data-driven decisions to optimize your virtual tours:
- For better flow: If viewers seem confused or exit early, consider enhancing the way they move around or adding more clear visual prompts.
- For increased engagement: If your Mattertags aren’t getting attention, try updating them with more interesting and relevant information.
- For wider accessibility: If many people are viewing on mobile, ensure the tour is designed to work smoothly on phones and tablets.
- Key Features: Use analytics to identify popular areas or features and highlight them in your marketing efforts.
Tracking the ROI of Your Virtual Tours
Matterport analytics can also help you track the return on investment (ROI) of your virtual tours. Specifically, by monitoring metrics like leads generated, bookings made, or sales conversions, you can measure the effectiveness of your virtual tours and, therefore, justify the investment
Accessing and Interpreting Matterport Analytics
Matterport provides easy-to-use dashboards and reports that visualize your analytics data. Specifically, you can access these reports within your Matterport account and, furthermore, filter the data by date range, space, or other criteria.
360thru: Your Matterport Analytics Experts
360thru can help you understand and interpret your Matterport analytics data, providing insights and recommendations to optimize your virtual tours for maximum impact. We offer comprehensive analytics reporting and consultation services to help you achieve your business goals. Contact us today to learn more.
